Multimodal NeuroImaging
Why multimodal neuroimaging?
Multimodal imaging provides a unique opportunity to investigate the temporal and topographical relationship between distinct pathological variables, and thus improve our understanding of pathophysiological interactions in vivo (Teipel et al., 2015). Additionally, it potentially offers the advantage of a combination of the complementary strengths of single imaging modalities, thus improving diagnostic accuracy compared with single imaging tests.
Over the years, the team has developed an expertise in combining different imaging modalities (e.g., structural MRI, functional MRI, FDG-PET, and AV45-PET) to further our understanding of the pathophysiological processes associated with AD and other neurodegenerative disorders. We provide bellow some illustrative studies of our multimodal neuroimaging investigations. It worth noting that several other studies from our laboratory also relied on multimodal imaging notably to assess the use of neuroimaging biomarkers in preclinical AD (Besson et al., 2015), explore the neural mechanisms underlying the positive effect of education (Arenaza-Urquijo et al., 2013) or the anosognosia of memory deficits (Perrotin et al., 2015).
Regional variations in the relative degree of brain alterations
In a series of works, we compared the relative degree of different brain alterations and assessed their relationship using methods specifically developed for the purpose of multimodal neuroimaging analyses. Such analyses are of particular interest to shed light on the sequence of regional pathological events and identify potential compensatory (relative metabolism preservation facing important structural alteration) or diaschisis (disproportionate hypometabolism as compared to more modest atrophy) mechanisms.
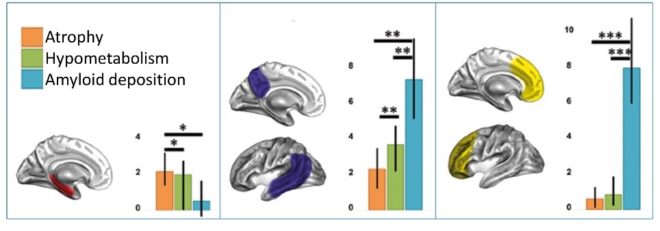
Our first studies in AD highlighted differences in the degree of atrophy, hypometabolism and Aβ deposition across brain regions (Chételat et al., 2008; La Joie et al., 2012). Specifically, we found that the hippocampus showed disproportionate atrophy (intermediate level of hypometabolism and almost no Aβ deposition), posterior associative temporal and parietal cortical areas showed disproportionate hypometabolism (and important degree of Aβ deposition) as compared to atrophy, while the frontal cortex was characterized by very high Aβ deposition and relatively weak atrophy and hypometabolism (Figure 1).
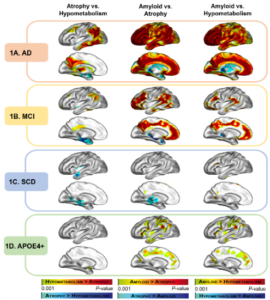
This suggests that there might be different underlying mechanisms, and possibly different pathological sequences, in these different groups of brain regions. This idea is supported by the distinct profile observed in groups at-risk of AD (Wirth et al., 2017). While the biomarker pattern seen in AD is fully recovered in MCI patients, the subjective cognitive decline (SCD) subjects only show disproportionate atrophy in medial temporal regions (as compared to the others modalities) and cognitively normal carriers of the Apolipoprotein E ε4 (APOE4) only present with Aβ deposition exceeding both atrophy and hypometabolism in frontal regions (Figure 2). This highlights that regional AD-like biomarker patterns may vary across different at-risk populations, potentially reflecting differential early mediators of these risks.
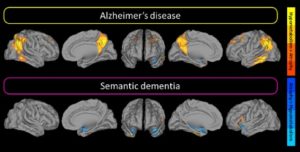
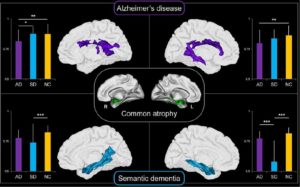
Interestingly, part of this multimodal signature may not be proper to AD. Indeed, both AD and semantic dementia (SD) present with more atrophy than hypometabolism in medial temporal lobe, possibly reflecting functional compensation mechanisms (Figure 3, Bejanin et al., 2017). However, the extended pattern of regions showing greater hypometabolism than atrophy was only observed in AD and may reflect the multidetermined pathological process of this disease (as compared to a relatively more unitary process in SD)
Local and distant relationships between the different neuroimaging biomarkers
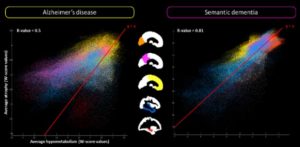
To provide a deeper understanding of the different neuroimaging biomarkers, we investigated their local versus distal relationships. This allowed us to demonstrate that hypometabolism correlates with local atrophy (by contrast to Aβ deposition) in groups at-risk of AD (Wirth et al., 2017) and AD (La Joie et al., 2012), even though a significant proportion of hypometabolism and atrophy remains unrelated (Chételat et al., 2009) and that their relationship can differ according to the brain regions (Figure 4)
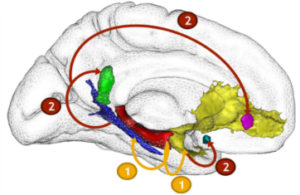
One possible reason for this discrepancy is that the hypometabolism in AD result at least partly from diaschisis mechanisms, i.e. distal effect of hippocampal atrophy on disconnected brain areas. We provided support to his hypothesis by showing, both cross-sectionally and longitudinally, that hippocampal atrophy leads to glucose hypometabolism in medial parietal regions via the disruption of the posterior cingulum bundle (Villain et al., 2008, 2010) (Figure 5). We also reported that the association between medial temporal lobe and cingulum bundle was specific to AD as compared to SD (Bejanin et al., 2016).
The role of (brain) connectivity in the pathophysiology of AD and semantic dementia (SD)
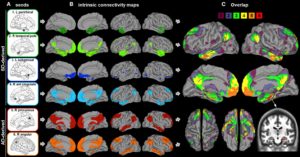
In a different set of studies, we investigated the paradox of semantic dementia (SD), i.e. the intriguing relative preservation of episodic memory in SD despite a similar degree of hippocampal atrophy compared with AD (La Joie et al., 2013, 2014; Bejanin et al. 2016). Using functional connectivity with resting-state fMRI, we found that both SD and AD affect brain regions that are connected to the hippocampus (Figure 6), but only the connectivity with brain regions affected in AD support episodic memory performances in healthy individuals.
We also showed that both diseases target different hippocampal networks, probably because they differentially affect the anterior versus posterior parts of the hippocampus, which are known to be connected to different brain regions (La Joie et al., 2014). This hypothesis found support in recent evidence showing that the atrophy common to both AD and SD is associated with alterations in different white matter areas, i.e., mainly the cingulum and corpus callosum in AD versus the uncinate and inferior longitudinal fasciculi in SD (Bejanin et al. 2016).