Advanced Neuroimaging Processing
Implementation of advanced neuroimaging processing and analysis, and applications to multimodal neuroimaging in Alzheimer’s disease
Multimodal surface analysis
In addition to voxel-wise (volume) analyses, we are developing or optimizing surface-based analyses on the cortical surface to specifically study the cortical ribbon. This vertex-wise approach has several advantages: (i) increase of the accuracy of brain registration compared with Talairach registration; (ii) 2D spatial smoothing of cortical data better suits the cortex topology; (iii) the reliability and detectability of statistical effects in PET imaging are improved.
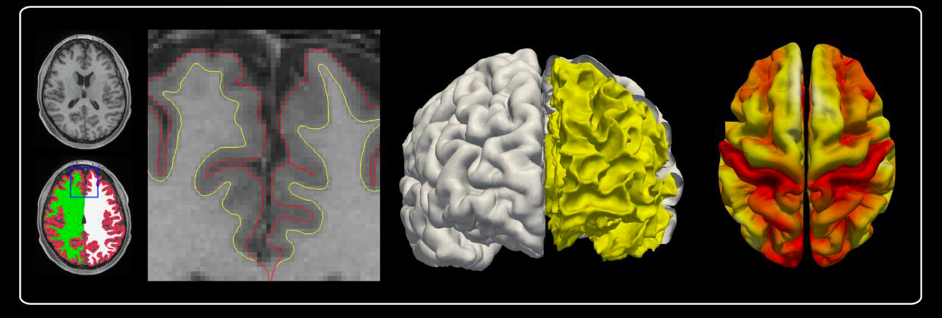
Structurally, cortical thickness, which is a straight neuroanatomical measure giving the thickness in millimeters of the cortical ribbon, is studied. A surface approach is used in order to calculate this cortical thickness, defined as the distance between the internal cortical surface modelling the WM/GM interface and the external surface modelling the GM/CSF interface (Figure 1). Cortical thickness is a very sensitive and specific measure of cortical atrophy.
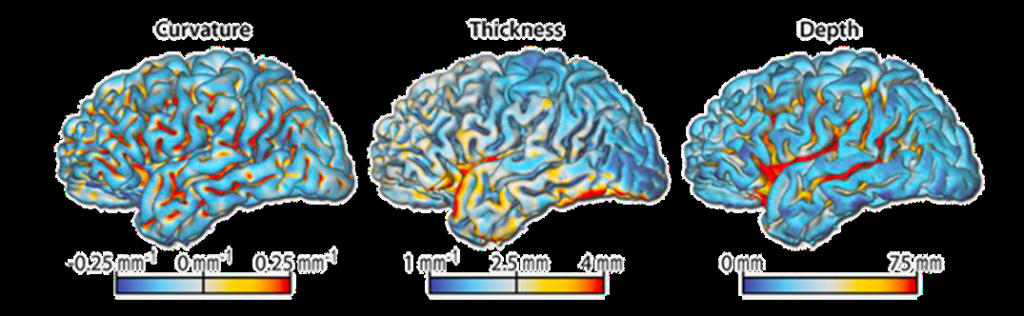
Brain surface meshes thus permit new forms of analyses, such as cortical thickness, gyrification assessing the mean absolute curvature or sulci depth based on the Euclidean distance between the central surface and its convex hull (Figure 2). Cortical atrophy, modifications of mean absolute curvature and sulci depth are common in many neurodegenerative diseases such as Alzheimer’s disease (Vanhoutte, 2018).
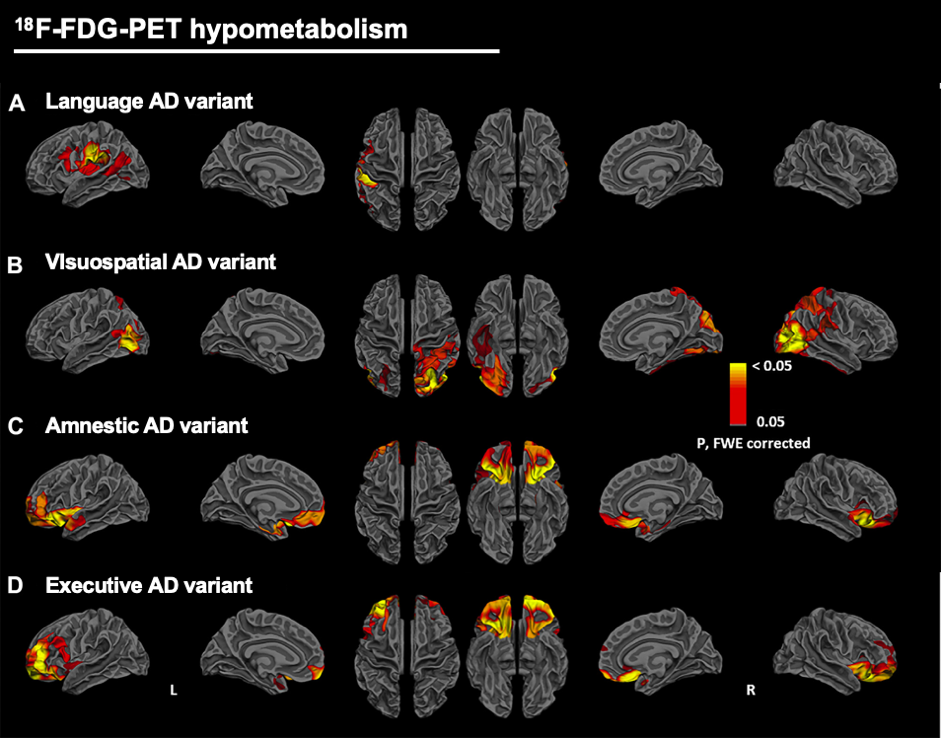
Functionally, we study multi-tracers PET uptake within the cortical ribbon by mapping preprocessed PET data onto the native cortical surface of the subject. So, FDG-PET vertex-wise analyses are conducted to study the cortical hypometabolic patterns in early-onset Alzheimer’s disease variants (Vanhoutte et al., 2017)(Figure 3); as well as early AV45-PET vertex-wise analyses are realized to assess the similarities between early AV45 and FDG uptakes at the cortical level; or even late AV45-PET and tau-PET vertex-wise analyses are conducted to assess the amyloid or tau deposition on the cortical surface in Alzheimer’s disease patients, while benefiting of the surface- versus volume-based analysis.
Multivariate approaches and machine learning
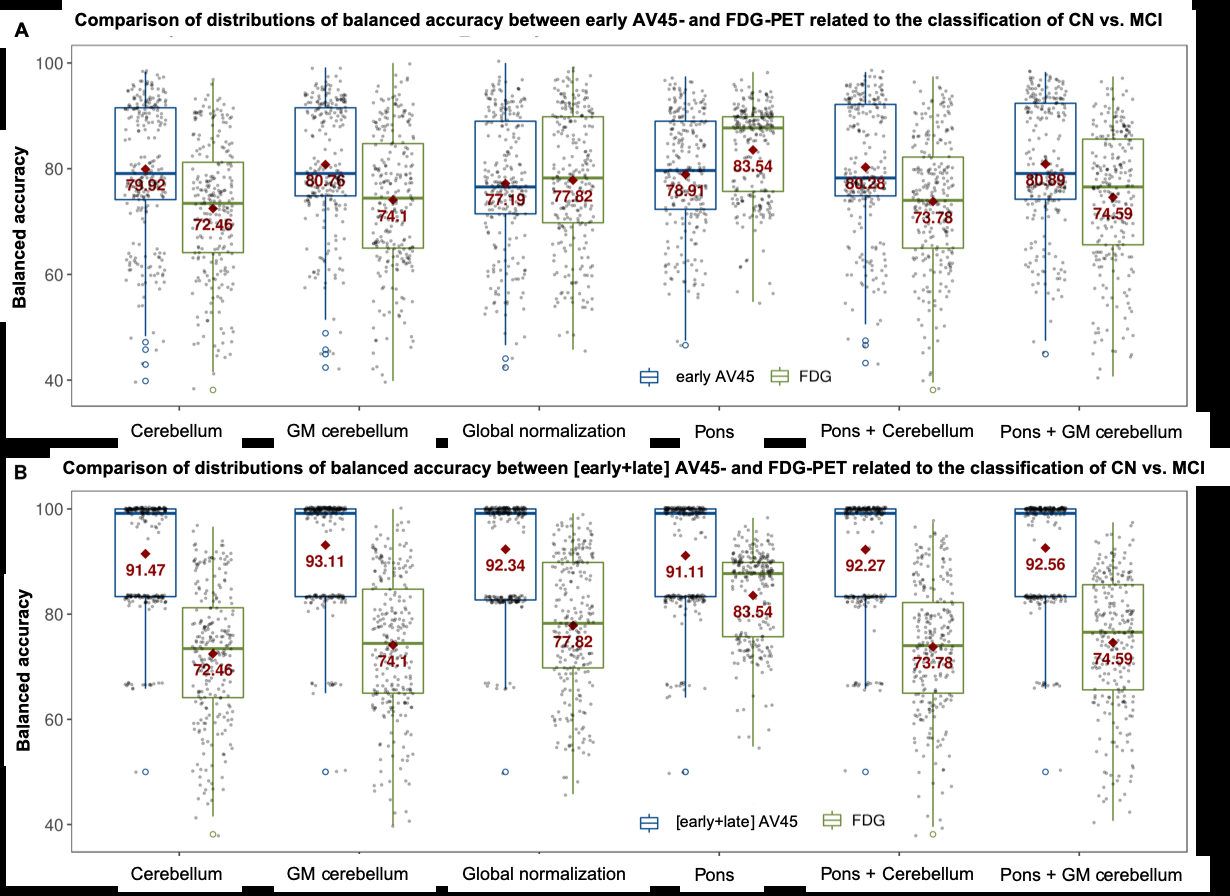
The fairly recent success of machine learning in neuroimaging is due to its multiple applications such as image segmentation, image registration, imager fusion and computer-aided diagnosis, while increasing automatization, sensitivity and specificity. In our laboratory, we particularly use supervised classification algorithms to automatically classify healthy controls versus MCI and/or AD patients by learning discriminative patterns coming from neuroimaging data (Figure 4). This approach allows multivariate direct comparisons of diagnostic power from different imaging modalities based on identical sets of patients. Furthermore, it offers the advantage of combining complementary strengths of each imaging modality, improving diagnostic precision compared to monomodal imaging exams.
References
Vanhoutte M. Caractérisation par imagerie TEP 18F-FDG de la maladie d’Alzheimer à début précoce [Internet]. 2018[cited 2019 Sep 7] Available from: https://tel.archives-ouvertes.fr/tel-02058920
Vanhoutte M, Semah F, Leclerc X, Sillaire AR, Jaillard A, Kuchcinski G, et al. Three-year changes of cortical 18F-FDG in amnestic vs. non-amnestic sporadic early-onset Alzheimer’s disease. Eur J Nucl Med Mol Imaging 2020; 47: 304–318.
Vanhoutte M, Semah F, Rollin Sillaire A, Jaillard A, Petyt G, Kuchcinski G, et al. 18F-FDG PET hypometabolism patterns reflect clinical heterogeneity in sporadic forms of early-onset Alzheimer’s disease. Neurobiol Aging 2017; 59: 184–196.